kōdōkalabs
AI Marketing Measurement and Value Realization

Measure: Prove the Value of AI Marketing Transformation

Measure is the fifth phase of The kōdōkalabs Transformation System. It compares operational, quality, capability, risk, and commercial performance with the baseline established in Diagnose so leaders can decide what to improve, stop, contain, or scale.

Executive Summary

Measure exists because “the team is using it” and “we’re saving time” are not, by themselves, evidence that an AI-enabled marketing workflow is creating value — and organizations that stop at those signals often can’t answer harder, more important questions: did quality hold up, did work reach the market faster in a way that mattered commercially, did capability actually transfer, did risk exposure change, and did costs genuinely fall or simply move somewhere less visible. Measurement, in kōdōkalabs’ model, is a decision system rather than a reporting layer bolted on after the fact — every measurement effort should terminate in a decision to improve, stop, contain, or scale a workflow, evaluated against the baseline Diagnose established. This page covers the seven-dimension AI Marketing Value Scorecard, how to measure quality, capability, risk, and commercial contribution without overclaiming, the full cost of running an AI-enabled workflow, and the decision path out of Measure.

Key Takeaways

  • Activity metrics (licence counts, prompt volume, output volume, informally estimated hours saved) are not, by themselves, business value.
  • Measurement always compares against the Diagnose baseline — without a baseline, “improvement” cannot be established.
  • The AI Marketing Value Scorecard evaluates seven dimensions: Efficiency, Execution velocity, Quality, Commercial contribution, Adoption and capability, Risk and control, Strategic learning.
  • Attribution and incrementality limits should be stated explicitly, not glossed over — unsupported causality claims undermine measurement credibility.
  • Every measurement cycle should end in a decision: improve, stop, contain, scale, or return to Diagnose.

What Is the Measure Phase?

Measure takes the operating workflow Enable handed over — with its documented baseline, capable team, and governance controls in place — and evaluates it against evidence: did operational performance improve, did quality hold or improve, did the team’s capability and adoption develop as intended, did risk exposure move in the right direction, and is there a defensible connection to commercial outcomes. The output of Measure isn’t a dashboard. It’s a decision, recorded in the Scale Decision Record, about what happens to the workflow next.

Why Activity Metrics Are Not Business Value

It’s common, and understandable, for organizations to describe an AI initiative as successful because licence seats are active, prompt or generation volume is high, output volume has risen, or someone estimates informally that the team is saving time. None of these signals, on their own, establish that quality remained acceptable, that faster output reached the market in a way that mattered commercially, that costs genuinely fell rather than shifting into unmeasured review time, that internal capability increased rather than dependency on a tool or vendor, that risk exposure changed for the better, or that the workflow is sustainable and worth scaling. Activity is easy to measure and readily available from vendor dashboards, which is exactly why it gets mistaken for value — measuring what’s convenient rather than what matters.

Start with the Diagnose Baseline

Measurement without a baseline can describe a workflow’s current state but can’t establish whether anything has improved — “improvement” is, definitionally, a comparison. Diagnose exists specifically to capture that starting point: current-state cost, cycle time, quality, and capability evidence, documented before the workflow changed. Measure’s first analytical step, for every dimension, is retrieving the relevant baseline figure and confirming it was captured under comparable conditions — comparing a post-implementation quarter against a pre-implementation quarter with a materially different team size or market condition, for instance, can distort the comparison in ways worth naming explicitly rather than silently absorbing into the result.

The Seven Dimensions of the AI Marketing Value Scorecard
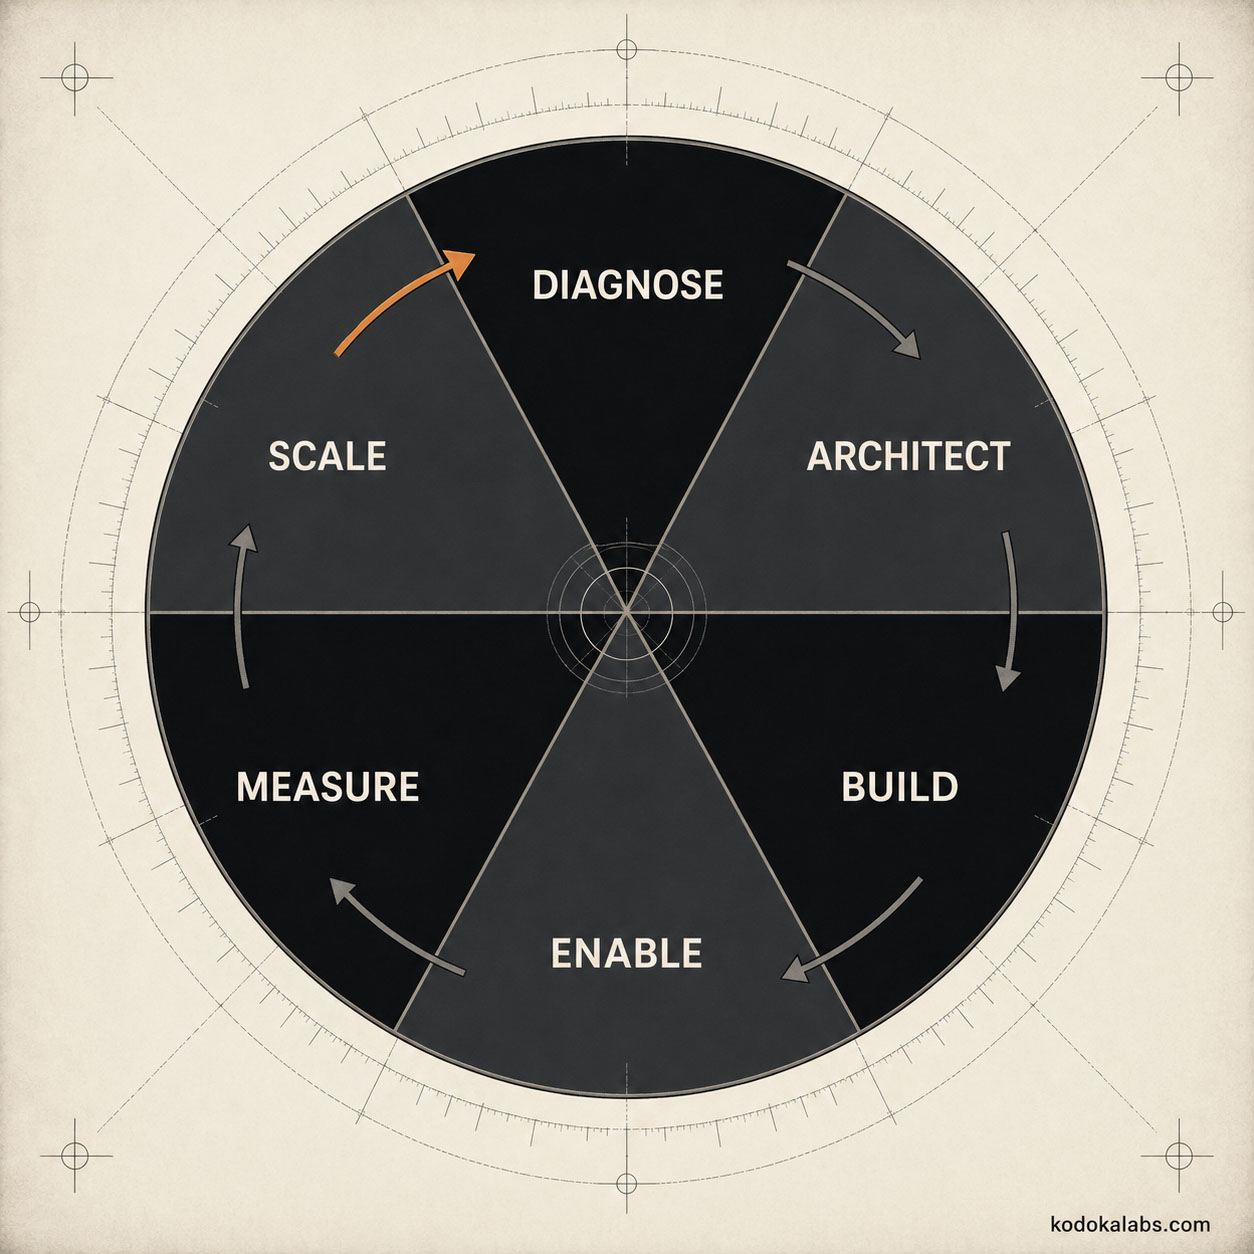
kōdōkalabs - Framework - Scale Phase - Scale to Diagnose Feedback Loop
kōdōkalabs - Framework - Measure Phase - Measure to Scale Feedback Loop

kōdōkalabs’ AI Marketing Value Scorecard evaluates transformation value across seven dimensions. This structure — the seven named dimensions and the decision logic connecting them — is kōdōkalabs’ own methodology, not an external or industry-standard framework; no numeric weights or pass/fail thresholds are asserted here as universal benchmarks, since defensible thresholds depend on the specific organization’s baseline and risk tolerance.

Dimension
What It Evaluates

Efficiency

Cost and resource consumption per unit of output, compared with the Diagnose baseline

Execution velocity

Cycle time from brief to published or deployed output

Quality

Accuracy, source support, brand adherence, usability, error and rework rate, approval performance

Commercial contribution

Connection between workflow output and business outcomes, with attribution limits stated

Adoption and capability

Whether the Enable phase’s Ownership Transfer Record holds up in ongoing operation

Risk and control

Whether governance controls are functioning as designed and risk exposure is trending as intended

Strategic learning

What the organization has learned about where AI is and isn’t creating value, feeding future Diagnose cycles

Efficiency

Efficiency compares the resource cost — time, budget, headcount — of producing a unit of output against the Diagnose baseline for the same unit of output, under comparable conditions.

Execution velocity

Execution velocity measures cycle time: how long work takes from brief or request to published or deployed output, again compared against baseline.

Quality

Quality is measured across several sub-components detailed in the dedicated section below — it is never collapsed into a single unexplained score.

Commercial contribution

Commercial contribution connects workflow performance to business outcomes where a defensible connection can be established, with attribution and incrementality limits stated rather than implied away.

Adoption and capability

Adoption and capability tracks whether the capability transfer achieved during Enable is holding up under real operating conditions — not a one-time check at handover, but an ongoing signal.

Risk and control

Risk and control evaluates whether the governance controls specified during Architect and implemented during Build are functioning as intended, and whether the workflow’s actual risk exposure is moving in the intended direction.

Strategic learning

Strategic learning captures what the measurement cycle reveals about where AI-assisted work is and isn’t creating value for this specific organization — feeding directly back into the next Diagnose cycle for adjacent workflows.

Leading, Operational, and Lagging Indicators

Not every useful signal arrives at the same time. Leading indicators (adoption rate, early error rate, practitioner confidence signals from Enable) surface quickly and hint at where a workflow is heading. Operational indicators (cycle time, cost per unit, throughput, approval-cycle length) reflect the workflow’s steady-state performance once it has stabilized. Lagging indicators (commercial contribution, sustained quality trend, realized cost savings) take longer to materialize but carry the most weight in a scale decision. Reading only leading indicators risks a premature scale decision based on early enthusiasm; waiting only for lagging indicators risks missing an early warning sign a leading indicator would have surfaced sooner.

Indicator Type
Examples
Typical Use

Leading

Early adoption rate, initial error rate, practitioner confidence
Early course-correction signal

Operational

Cycle time, cost per unit, throughput, approval-cycle length
Steady-state performance tracking

Lagging

Commercial contribution, sustained quality trend, realized savings
Scale/stop/contain decision weight

How to Measure Quality

Quality measurement covers several distinct sub-components, deliberately not collapsed into one unexplained composite score.
Quality Component
What It Captures

Accuracy

Whether factual claims in output are correct and verifiable

Source support

Whether claims are backed by a checkable source, per the Editorial Trust Standard

Brand adherence

Whether tone, terminology, and positioning match approved brand standards

Usability

Whether the output is genuinely usable without disproportionate rework

Error and rework rate

How often output requires correction, and how much correction it requires

Approval performance

How output performs at each governance checkpoint it passes through

Audience or customer response

How the intended audience responds, where that signal is available and attributable

Each component should be tracked against its own Diagnose-phase baseline where one exists, rather than judged only in isolation.

How to Measure Capability and Adoption

Capability and adoption measurement in Measure extends what Enable’s Ownership Transfer Record established at handover: is the operating team still performing at the level they were certified to, is documentation being kept current, are exceptions being handled correctly without escalating every edge case back to the original implementer, and is the internal champion (where one exists) actively extending capability to new team members. A workflow that looked fully enabled at handover but has quietly reverted to heavy implementer dependency six months later is a capability regression worth surfacing, not a stable state.

How to Measure Risk and Control Performance

Risk and control measurement checks whether the governance controls specified during Architect are actually functioning: are review checkpoints being observed in practice, are escalations happening when they should, is the risk classification for the workflow still accurate given how it’s actually being used, and has any near-miss or control failure occurred. This dimension deliberately doesn’t wait for an incident to justify attention — a control that exists on paper but has quietly stopped being followed is a risk signal in its own right, independent of whether it has yet produced a visible failure.

Connecting Workflow Performance to Commercial Outcomes

Connecting AI-assisted workflow performance to commercial outcomes — revenue, pipeline, conversion, retention — is often the measurement organizations most want and least reliably get, because marketing outcomes are influenced by many factors beyond any single workflow: market conditions, competitive activity, seasonality, pricing changes, and unrelated campaigns running concurrently. A credible measurement approach states explicitly what can and can’t be attributed to the workflow, distinguishes correlation from demonstrated incrementality where a genuine test (such as a holdout or phased rollout) exists, and names the confounding factors that limit confidence. Where a defensible causal or incremental connection genuinely can’t be established, Measure says so directly rather than implying a causal story the evidence doesn’t support — a credible “we can’t yet attribute this precisely, and here’s why” is more valuable to a decision-maker than an overstated claim that later has to be walked back.

Total Cost of an AI-Enabled Workflow

Efficiency claims that count only the licence fee against output volume routinely understate the true cost of running an AI-enabled workflow.

Cost Category
What It Includes

Technology

Licences, API usage, infrastructure

Integration

Connecting the workflow into existing systems and data sources

Human review

Time spent reviewing, correcting, and approving output

Maintenance

Keeping prompts, instructions, and knowledge bases current

Governance

Time spent on classification, review, and audit activity

Training

Ongoing enablement for new team members or role changes

Exception handling

Time spent resolving cases the workflow doesn’t handle automatically

Opportunity cost

What the team would otherwise have been doing with that time

A workflow that looks dramatically efficient when only the licence fee is counted can look considerably less so once human review and exception-handling time are added back in — and that fuller picture is the one a genuine scale decision should be based on.

Measurement Cadence and Executive Review

Measurement works best on a defined cadence rather than an ad hoc basis — frequent enough to catch problems early, infrequent enough not to burden the operating team with constant reporting overhead. A typical structure separates operational monitoring (reviewed by the workflow owner on a short cycle) from executive review (reviewed by the sponsor and governance stakeholders on a longer cycle, feeding directly into the Scale Decision Record). What matters more than the specific cadence chosen is that a review is scheduled, owned, and produces a recorded decision — not that measurement happens continuously with no defined moment where a decision actually gets made.

Measure Outputs and Exit Criteria

Measure is complete when the seven scorecard dimensions have been evaluated against baseline using at least observed-level evidence per kōdōkalabs’ Metric Evidence Hierarchy (anecdotal, observed, measured, validated — with the level achieved for each dimension stated explicitly), attribution limitations are documented rather than implied away, and a completed Scale Decision Record has been produced: performance against baseline, quality threshold, risk threshold, operating cost, adoption evidence, commercial evidence where feasible, unresolved limitations, decision, owner, and next review date.

Evidence Level
What It Means

Anecdotal

Individual reports or impressions, not systematically collected

Observed

Noted informally across multiple instances, not yet formally tracked

Measured

Systematically collected using a defined method

Validated

Measured and independently checked or replicated
Scale Decision Record Field
Content

Performance vs. baseline

Result on each scorecard dimension compared with Diagnose baseline

Quality threshold

Whether quality met the organization’s defined acceptable level

Risk threshold

Whether risk exposure stayed within approved boundaries

Operating cost

Full cost per the total-cost model above

Adoption evidence

Capability and adoption status per Enable’s Ownership Transfer Record

Commercial evidence

Connection to commercial outcomes, with attribution limits stated

Unresolved limitations

What remains uncertain or unmeasured

Decision

Improve, stop, contain, or scale

Owner

Named individual accountable for the decision

Next review date

When the decision will be revisited
Each model trades off local responsiveness against consistency differently, and an organization may reasonably use different models for different workflows depending on their risk classification and complexity.

Common Measurement Failure Modes

  • Activity mistaken for value – reporting licence usage or output volume as if it were proof of business impact.
  • No baseline – attempting to claim improvement without a documented pre-implementation comparison point.
  • Composite scores without transparency – presenting a single blended score without showing the underlying dimensions, weights, or evidence level behind it.
  • Overstated attribution – claiming a direct causal link to revenue or pipeline without acknowledging confounding factors.
  • Partial cost accounting – counting only licence cost while ignoring review, maintenance, governance, and exception-handling time.
  • Measurement without a decision – running the analysis but never producing a recorded improve/stop/contain/scale decision.
  • One-sided decision framing – treating “scale” as the only acceptable outcome, which quietly biases how evidence gets interpreted.

From Measure to Scale — or Back to Diagnose

Measure’s completed Scale Decision Record feeds directly into Scale when the decision is to scale, or back into a fresh Diagnose cycle when the decision is to improve, stop, or contain and the organization wants to explore a redesigned approach to the same problem. Both paths are legitimate outcomes of a working measurement system — a workflow that gets contained or stopped based on honest evidence is not a failure of the Transformation System; it’s the system doing exactly what it’s designed to do.

Frequently Asked Questions - Measure Phase - (FAQ)

By evaluating performance against the Diagnose baseline across the seven scorecard dimensions — efficiency, execution velocity, quality, commercial contribution, adoption and capability, risk and control, and strategic learning — rather than relying on activity metrics like licence usage or output volume alone.
Because it doesn't establish whether quality held up, costs genuinely fell, capability transferred, or risk changed — see "Why Activity Metrics Are Not Business Value" above.
Efficiency, execution velocity, quality, commercial contribution, adoption and capability, risk and control, and strategic learning — detailed in the scorecard table above.
Across accuracy, source support, brand adherence, usability, error and rework rate, approval performance, and audience response — see "How to Measure Quality."
By stating explicitly what can and can't be attributed to the workflow, naming confounding factors, and using genuine incrementality tests (such as holdouts) where they exist, rather than implying a causal story the evidence doesn't support.
Technology, integration, human review, maintenance, governance, training, exception handling, and opportunity cost — not just the licence fee. See the total-cost table above.
On a defined cadence separating routine operational monitoring from periodic executive review, ending in a recorded decision — see "Measurement Cadence and Executive Review."
The Scale Decision Record can recommend improve, stop, or contain rather than scale — all legitimate outcomes; the workflow may return to Diagnose for redesign.
A four-level framework — anecdotal, observed, measured, validated — used to state explicitly how rigorously each scorecard dimension was actually evaluated, rather than presenting all evidence as equally strong.
A completed Scale Decision Record recommending scale becomes the direct input to the Scale phase; a decision to improve, stop, or contain instead routes back into Diagnose.

Ready to
Measure What Your AI Marketing Systems Are Actually Delivering?

If you’re tired of fragmented, keyword-centric strategies, it’s time to build a foundation that withstands algorithm shifts. Let’s start with the blueprint that guarantees high-ROI execution.