
kōdōkalabs
AI Marketing Measurement and Value Realization
Measure: Prove the Value of AI Marketing Transformation
Executive Summary
Key Takeaways
- Activity metrics (licence counts, prompt volume, output volume, informally estimated hours saved) are not, by themselves, business value.
- Measurement always compares against the Diagnose baseline — without a baseline, “improvement” cannot be established.
- The AI Marketing Value Scorecard evaluates seven dimensions: Efficiency, Execution velocity, Quality, Commercial contribution, Adoption and capability, Risk and control, Strategic learning.
- Attribution and incrementality limits should be stated explicitly, not glossed over — unsupported causality claims undermine measurement credibility.
- Every measurement cycle should end in a decision: improve, stop, contain, scale, or return to Diagnose.
What Is the Measure Phase?
Why Activity Metrics Are Not Business Value
Start with the Diagnose Baseline
The Seven Dimensions of the AI Marketing Value Scorecard
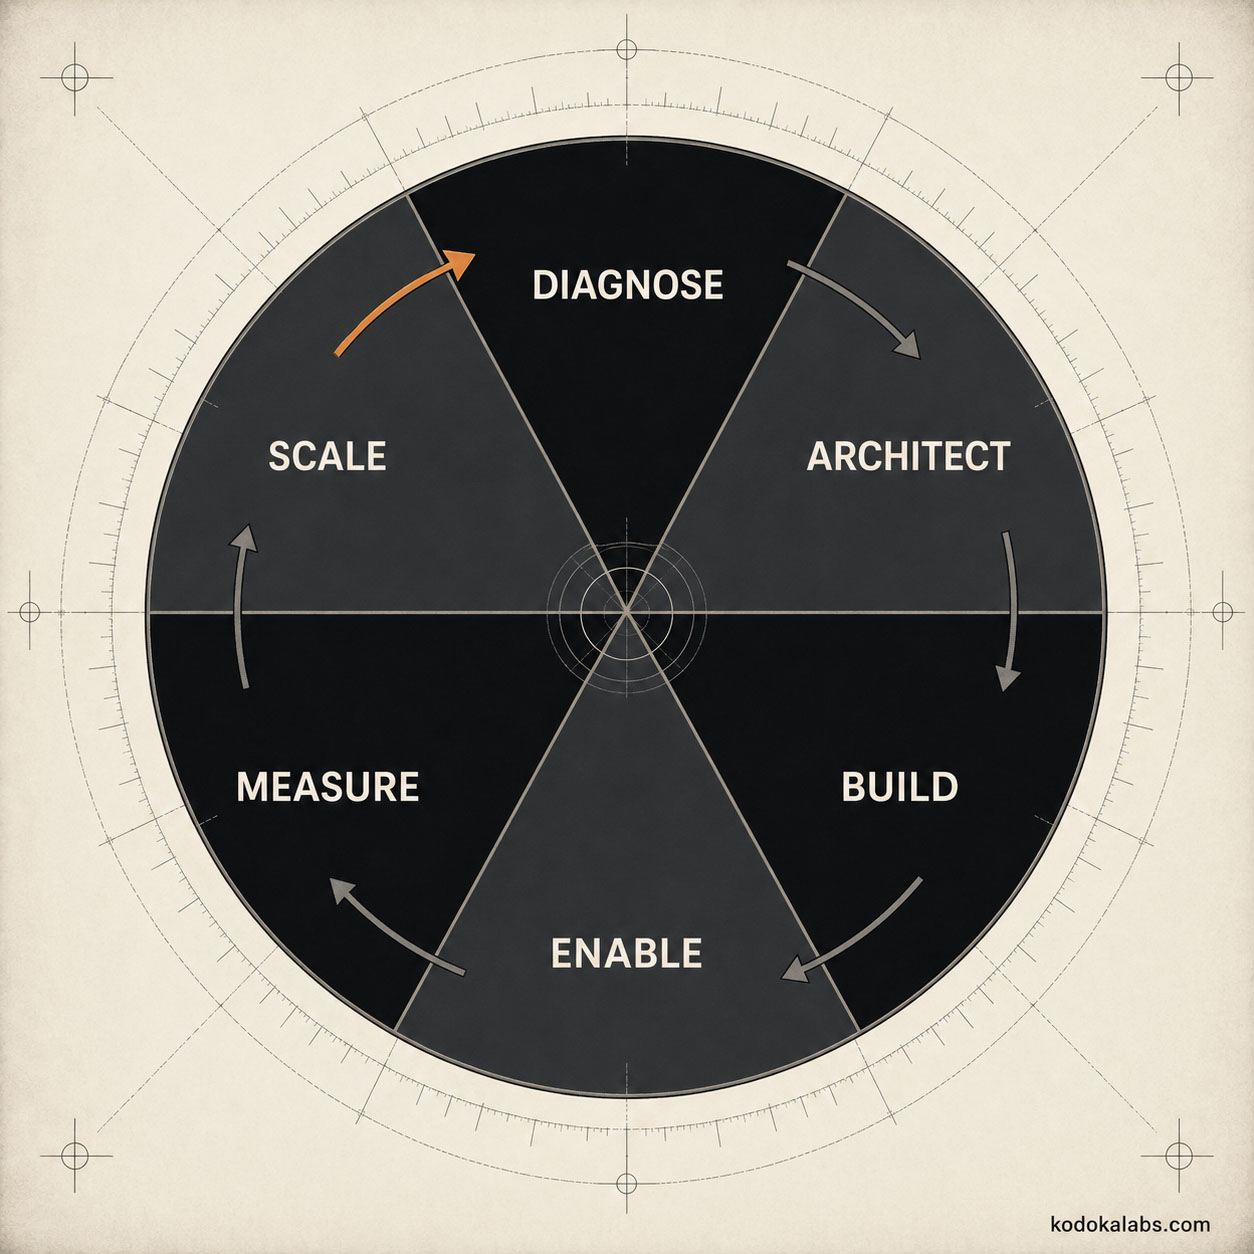
kōdōkalabs’ AI Marketing Value Scorecard evaluates transformation value across seven dimensions. This structure — the seven named dimensions and the decision logic connecting them — is kōdōkalabs’ own methodology, not an external or industry-standard framework; no numeric weights or pass/fail thresholds are asserted here as universal benchmarks, since defensible thresholds depend on the specific organization’s baseline and risk tolerance.
| Dimension | What It Evaluates |
|---|---|
| Efficiency | Cost and resource consumption per unit of output, compared with the Diagnose baseline |
| Execution velocity | Cycle time from brief to published or deployed output |
| Quality | Accuracy, source support, brand adherence, usability, error and rework rate, approval performance |
| Commercial contribution | Connection between workflow output and business outcomes, with attribution limits stated |
| Adoption and capability | Whether the Enable phase’s Ownership Transfer Record holds up in ongoing operation |
| Risk and control | Whether governance controls are functioning as designed and risk exposure is trending as intended |
| Strategic learning | What the organization has learned about where AI is and isn’t creating value, feeding future Diagnose cycles |
Efficiency
Execution velocity
Quality
Commercial contribution
Adoption and capability
Risk and control
Strategic learning
Leading, Operational, and Lagging Indicators
Not every useful signal arrives at the same time. Leading indicators (adoption rate, early error rate, practitioner confidence signals from Enable) surface quickly and hint at where a workflow is heading. Operational indicators (cycle time, cost per unit, throughput, approval-cycle length) reflect the workflow’s steady-state performance once it has stabilized. Lagging indicators (commercial contribution, sustained quality trend, realized cost savings) take longer to materialize but carry the most weight in a scale decision. Reading only leading indicators risks a premature scale decision based on early enthusiasm; waiting only for lagging indicators risks missing an early warning sign a leading indicator would have surfaced sooner.
| Indicator Type | Examples | Typical Use |
|---|---|---|
| Leading | Early adoption rate, initial error rate, practitioner confidence | Early course-correction signal |
| Operational | Cycle time, cost per unit, throughput, approval-cycle length | Steady-state performance tracking |
| Lagging | Commercial contribution, sustained quality trend, realized savings | Scale/stop/contain decision weight |
How to Measure Quality
Quality measurement covers several distinct sub-components, deliberately not collapsed into one unexplained composite score.
| Quality Component | What It Captures |
|---|---|
| Accuracy | Whether factual claims in output are correct and verifiable |
| Source support | Whether claims are backed by a checkable source, per the Editorial Trust Standard |
| Brand adherence | Whether tone, terminology, and positioning match approved brand standards |
| Usability | Whether the output is genuinely usable without disproportionate rework |
| Error and rework rate | How often output requires correction, and how much correction it requires |
| Approval performance | How output performs at each governance checkpoint it passes through |
| Audience or customer response | How the intended audience responds, where that signal is available and attributable |
Each component should be tracked against its own Diagnose-phase baseline where one exists, rather than judged only in isolation.
How to Measure Capability and Adoption
How to Measure Risk and Control Performance
Connecting Workflow Performance to Commercial Outcomes
Total Cost of an AI-Enabled Workflow
Efficiency claims that count only the licence fee against output volume routinely understate the true cost of running an AI-enabled workflow.
| Cost Category | What It Includes |
|---|---|
| Technology | Licences, API usage, infrastructure |
| Integration | Connecting the workflow into existing systems and data sources |
| Human review | Time spent reviewing, correcting, and approving output |
| Maintenance | Keeping prompts, instructions, and knowledge bases current |
| Governance | Time spent on classification, review, and audit activity |
| Training | Ongoing enablement for new team members or role changes |
| Exception handling | Time spent resolving cases the workflow doesn’t handle automatically |
| Opportunity cost | What the team would otherwise have been doing with that time |
A workflow that looks dramatically efficient when only the licence fee is counted can look considerably less so once human review and exception-handling time are added back in — and that fuller picture is the one a genuine scale decision should be based on.
Measurement Cadence and Executive Review
Measure Outputs and Exit Criteria
Measure is complete when the seven scorecard dimensions have been evaluated against baseline using at least observed-level evidence per kōdōkalabs’ Metric Evidence Hierarchy (anecdotal, observed, measured, validated — with the level achieved for each dimension stated explicitly), attribution limitations are documented rather than implied away, and a completed Scale Decision Record has been produced: performance against baseline, quality threshold, risk threshold, operating cost, adoption evidence, commercial evidence where feasible, unresolved limitations, decision, owner, and next review date.
| Evidence Level | What It Means |
|---|---|
| Anecdotal | Individual reports or impressions, not systematically collected |
| Observed | Noted informally across multiple instances, not yet formally tracked |
| Measured | Systematically collected using a defined method |
| Validated | Measured and independently checked or replicated |
| Scale Decision Record Field | Content |
|---|---|
| Performance vs. baseline | Result on each scorecard dimension compared with Diagnose baseline |
| Quality threshold | Whether quality met the organization’s defined acceptable level |
| Risk threshold | Whether risk exposure stayed within approved boundaries |
| Operating cost | Full cost per the total-cost model above |
| Adoption evidence | Capability and adoption status per Enable’s Ownership Transfer Record |
| Commercial evidence | Connection to commercial outcomes, with attribution limits stated |
| Unresolved limitations | What remains uncertain or unmeasured |
| Decision | Improve, stop, contain, or scale |
| Owner | Named individual accountable for the decision |
| Next review date | When the decision will be revisited |
Common Measurement Failure Modes
- Activity mistaken for value – reporting licence usage or output volume as if it were proof of business impact.
- No baseline – attempting to claim improvement without a documented pre-implementation comparison point.
- Composite scores without transparency – presenting a single blended score without showing the underlying dimensions, weights, or evidence level behind it.
- Overstated attribution – claiming a direct causal link to revenue or pipeline without acknowledging confounding factors.
- Partial cost accounting – counting only licence cost while ignoring review, maintenance, governance, and exception-handling time.
- Measurement without a decision – running the analysis but never producing a recorded improve/stop/contain/scale decision.
- One-sided decision framing – treating “scale” as the only acceptable outcome, which quietly biases how evidence gets interpreted.
From Measure to Scale — or Back to Diagnose
Measure’s completed Scale Decision Record feeds directly into Scale when the decision is to scale, or back into a fresh Diagnose cycle when the decision is to improve, stop, or contain and the organization wants to explore a redesigned approach to the same problem. Both paths are legitimate outcomes of a working measurement system — a workflow that gets contained or stopped based on honest evidence is not a failure of the Transformation System; it’s the system doing exactly what it’s designed to do.