
Content Production Efficiency: Improve Flow Without Sacrificing Quality
The content supply chain is the network of demand signals, knowledge inputs, expert capacity, production stages, systems, handoffs, approvals, distribution paths, and feedback loops required to move work from a justified need to a maintained, published asset. Content is not a commodity, but the queues, dependencies, bottlenecks, and quality gates that move it through an organization are operationally real and worth designing deliberately.
Key Takeaways for Content Supply Chain
- Efficiency is not volume. An organization producing twice as much content with the same quality bar and the same review capacity has not necessarily become more efficient; it may simply have shifted its bottleneck downstream.
- Flow metrics, cycle time, queue time, work in progress, first-pass yield, matter more than raw output counts, because they reveal where time is actually going rather than just how much got produced.
- Every efficiency metric needs a quality or value guardrail attached to it. A metric tracked without one will eventually get optimized in a way that damages the thing it was never designed to protect.
- The real constraint in most AI-assisted content operations has shifted from drafting to research, review, or specialist availability, and improvement effort should follow the constraint, not assumptions about where it used to sit.
- Time saved during drafting is not automatically realized business value. That gap only closes when the saved time is actually redirected toward higher-value work or genuinely reduces cost, rather than simply disappearing into more volume of the same kind of content.
Definition and Metric Correction
Content production efficiency is the reliable conversion of approved inputs into valuable, publishable, reusable content assets with the least avoidable delay, rework, risk, and waste. It is explicitly not the same thing as maximum output per person or per dollar, and conflating the two is the single most common mistake we see organizations make once AI assistance makes faster drafting possible.
The correction this guide makes is specific: AI changes the economics of content production unevenly across its stages. Drafting can accelerate dramatically, while research, specialist review, expert availability, and approval processes remain exactly as constrained as they were before. A measurement system that only tracks drafting speed, or that treats total content volume as the primary efficiency signal, will consistently miss this, celebrating a drafting-stage improvement that, measured end to end, didn’t actually make the system faster or better at all.
This guide connects directly to the AI Editorial Operating System’s four-stage model and to Content Supply Chain’s capacity and resilience view; where those guides define how content should move through the system, this guide defines how to measure whether it’s actually moving well, and what to do when it isn’t. The distinction matters because a content organization can be executing its stages correctly, following every defined contract, and still be inefficient overall if nobody is measuring flow, quality, and cost together across the whole system rather than within any single stage considered on its own.
Map the Actual Workflow
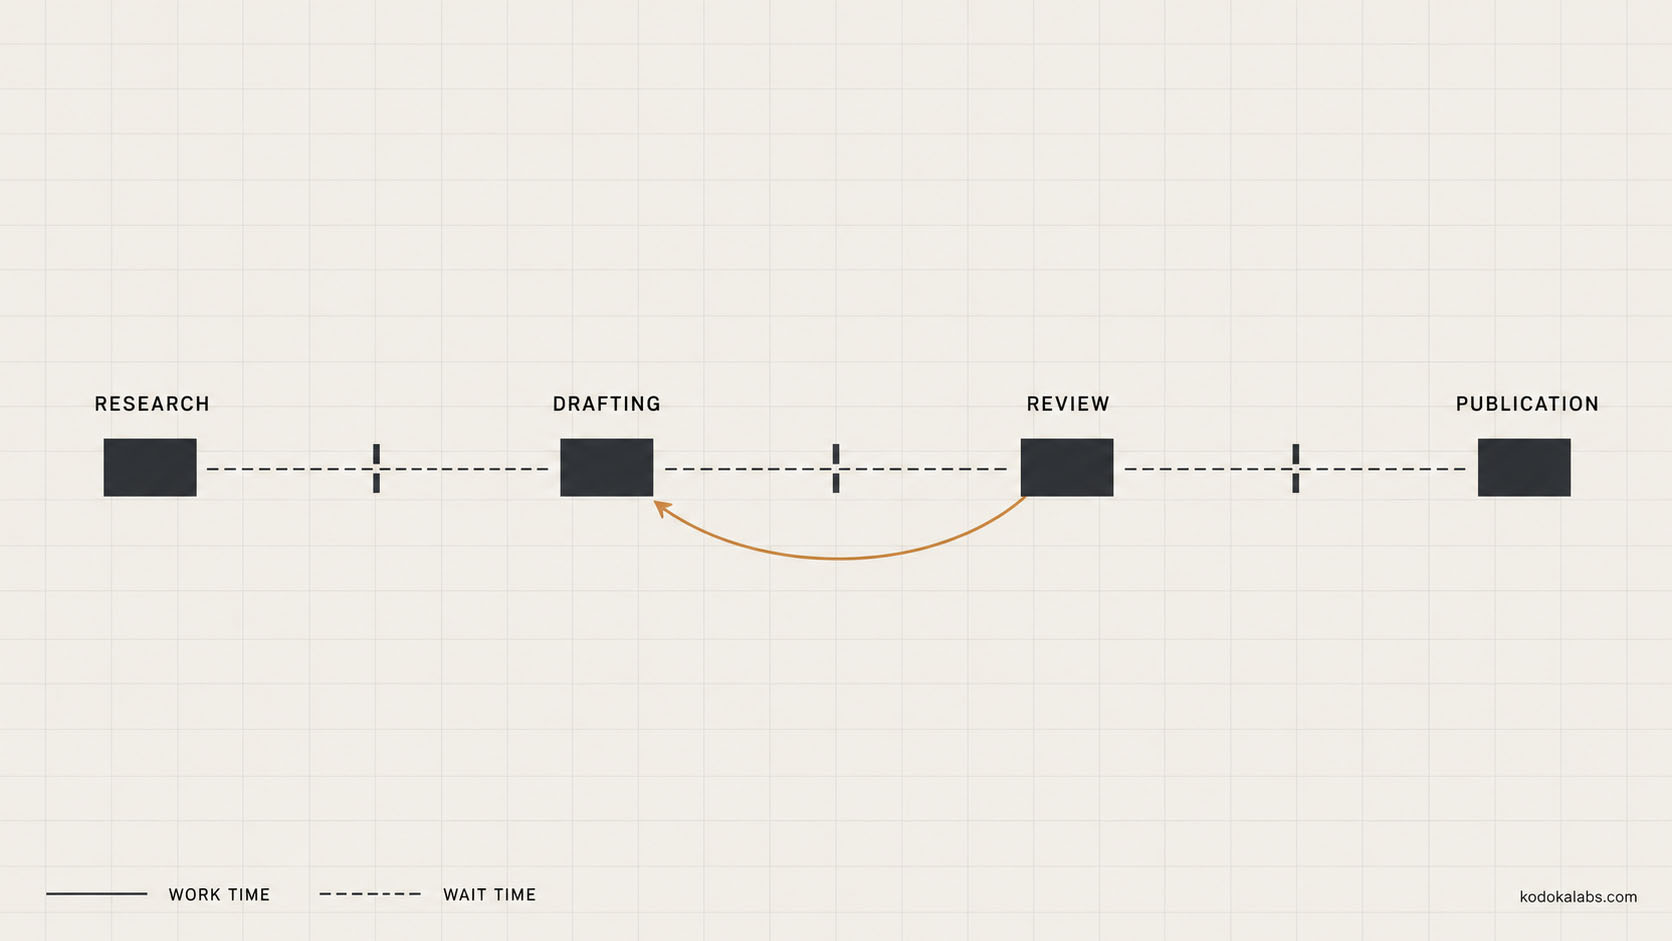
Before measuring anything, the workflow needs to be mapped as it actually operates, not as the organization’s documentation describes it operating. This mapping should capture every queue (where work waits before someone starts on it), every unit of actual work (where someone or something is actively processing it), every handoff between roles or systems, every rework loop (where work returns to an earlier stage), and every quality gate it passes through.
Most organizations discover, the first time they map this honestly, that a meaningful share of a piece of content’s total elapsed time is spent waiting rather than being worked on. This matters because efficiency improvement aimed only at the active-work portions of the process, making drafting faster, making review checklists shorter, leaves the waiting time untouched, and waiting time is very often the larger share of total cycle time in a real content operation.
Mapping honestly also means resisting the temptation to map the process as a tidy, linear sequence when the real version includes loops, exceptions, and informal shortcuts. A content request that gets escalated out of the normal queue because a senior stakeholder asked for it directly is a real part of the workflow, even if it doesn’t appear in the documented process, and it displaces other queued work in a way that should be visible rather than treated as an invisible exception each time it happens. The goal of mapping isn’t to produce a clean diagram for a presentation; it’s to produce an accurate enough picture that the measurement work in the next section actually reflects reality.
The map should be built from direct observation of actual work, rather than from interviews alone about how people believe the process runs. The two versions reliably diverge, and not out of any intent to misrepresent anything: people tend to describe the process the way it was designed, or the way it ran most recently when things went smoothly, rather than the way it actually runs on an average week that includes a rush request, an unavailable reviewer, or a piece of content that bounced twice before clearing. Watching a handful of pieces of content move through the real system, timestamp by timestamp, surfaces gaps that no amount of asking people to describe their own workflow reliably catches, simply because people are describing their intention for the process rather than auditing their own recent experience of it in detail.
Measure Flow and Quality
Flow metrics and quality metrics need to be tracked together, never in isolation from each other. Cycle time measures total elapsed time from a content request’s intake to its publication. Queue time measures how long work waits before someone starts actively processing it, separate from touch time, the time actually spent working on it. Throughput measures how much content completes per period. Work in progress measures how much content is active across the pipeline at once, a useful early-warning signal since rising work in progress with flat throughput usually indicates a developing bottleneck before it becomes visible as a delivery delay. First-pass yield measures what share of content clears review without requiring substantive revision, a strong proxy for how well upstream stages, briefing, drafting, are actually working. Defect and rework rates measure how often content needs to be sent back, and for what reason, which points directly at where quality problems originate rather than just where they’re caught.
Every one of these metrics needs an explicit guardrail attached to it, because a flow metric tracked in isolation will eventually get gamed, often unintentionally, in a way that damages whatever it wasn’t designed to measure. Cycle time improvement with no quality guardrail will eventually get achieved by cutting review depth. Throughput improvement with no value guardrail will eventually get achieved by producing more low-value content rather than better-targeted content.
This isn’t a hypothetical risk; it’s close to an inevitability whenever a single metric becomes the primary thing a team is evaluated against. A reviewer whose performance is measured mainly on how many pieces they clear per week will, understandably and without any bad intent, start finding ways to clear pieces faster, and the easiest way to do that is almost always to look less closely. Pairing every speed-oriented metric with an explicit, equally visible quality or value metric, and making clear that both are evaluated together rather than one being a secondary afterthought, is what keeps this dynamic from playing out.
The same dynamic applies to drafting, not only to review. A writer evaluated mainly on drafts produced per week, with no quality-adjusted counterpart metric visible alongside it, will rationally gravitate toward whichever content is fastest to draft rather than whichever content is most valuable to produce, even when nobody involved intends that outcome. This is a structural consequence of how the metric is built, not a judgment about anyone’s professionalism or effort, and it recurs reliably across different teams and different organizations precisely because it follows from incentive structure rather than from individual character. The fix is the same one that applies at the review stage: never let a speed metric stand alone as the thing a role is measured against.
| Metric | Formula | Data source | Owner | Guardrail | Decision it informs |
|---|---|---|---|---|---|
| Cycle time | Publication date minus intake date | Content management system timestamps | Content operations leader | Must not improve by reducing review depth below risk-tier requirement | Whether current lead times meet business commitments |
| Queue time | Time waiting minus time actively worked | Stage-level timestamps | Content operations leader | Track separately from touch time to avoid masking wait-time problems | Where to invest in capacity or process redesign |
| First-pass yield | Content approved without substantive revision divided by total reviewed | Review Evidence Pack records | Governance owner | Must be read alongside defect severity, not as a standalone success metric | Whether upstream briefing and drafting quality is improving |
| Rework rate | Content returned for revision divided by total content reviewed | Review Evidence Pack records | Content operations leader | Must distinguish rework cause (research gap, drafting error, scope change) | Which upstream stage needs process improvement |
| Cost per approved asset | Total allocated cost divided by approved, published assets | Finance and operations records | Finance partner with content operations leader | Must include review, specialist, and maintenance cost, not drafting cost alone | Capacity investment and tooling decisions |
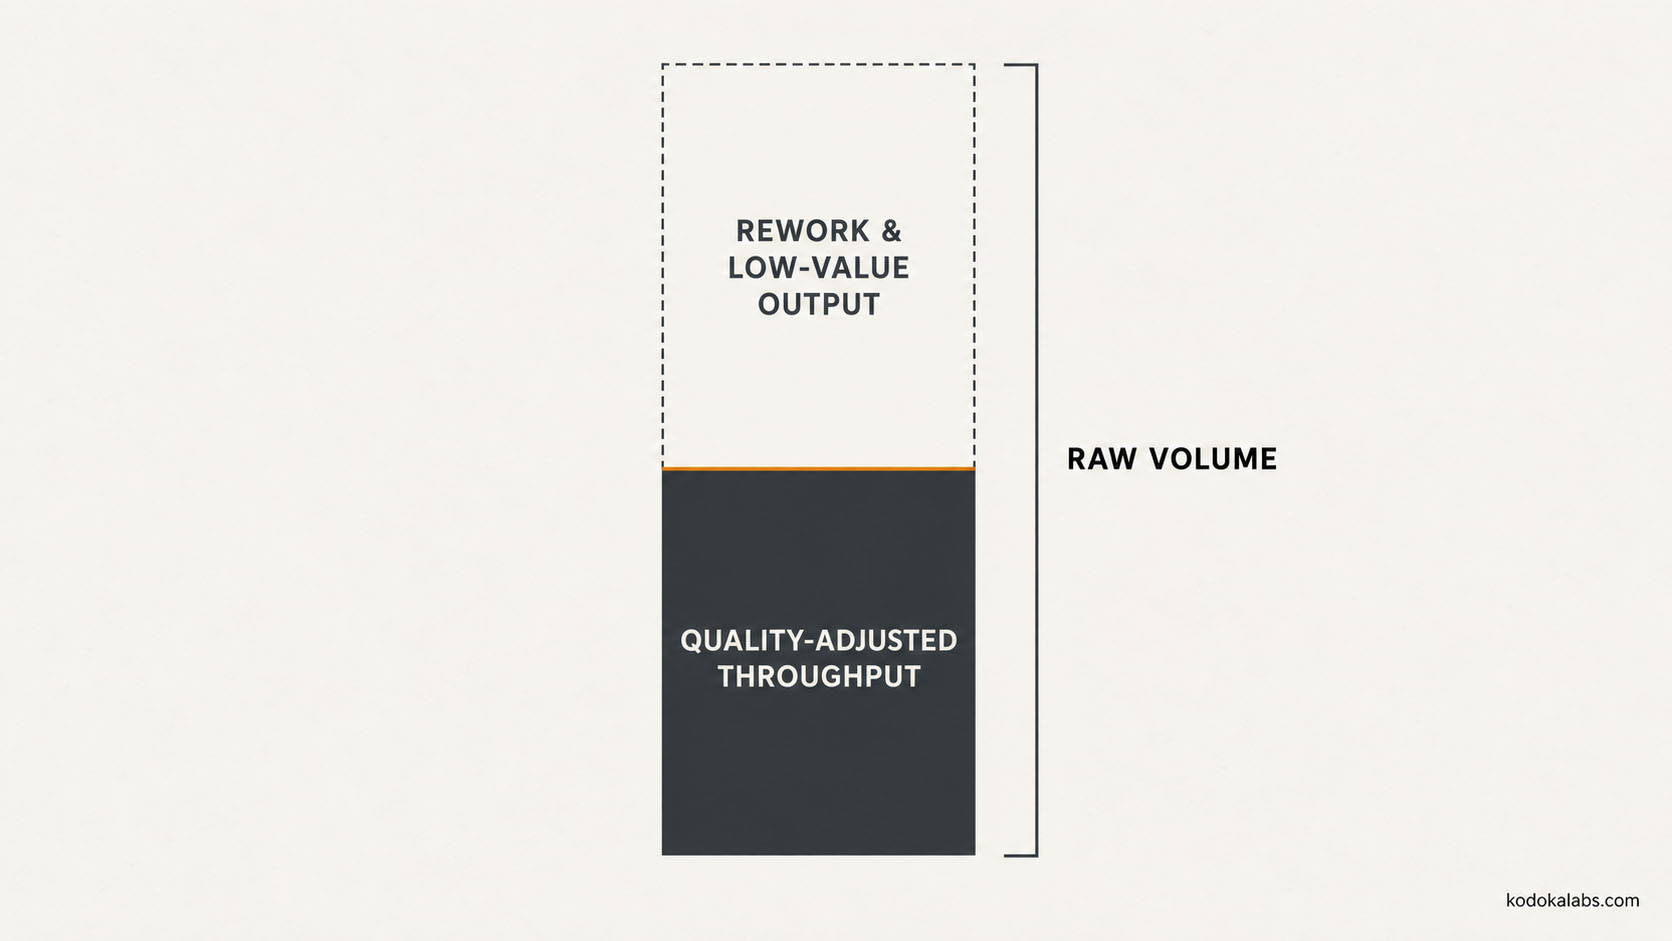
| Quality-adjusted throughput | Approved output volume weighted by defect-free rate and business relevance | Combined review and performance data | Content operations leader | Never reported as raw volume alone | Whether genuine capacity gains are being realized |
Find the Constraint
Once flow is mapped and measured, the actual constraint, the single stage most responsible for limiting the system’s overall throughput, usually reveals itself through where work-in-progress accumulates and where blocked time concentrates. In most AI-assisted content operations we observe, this constraint has moved from drafting, which used to be the slowest stage before AI assistance, to research, specialist review, or an expert whose availability doesn’t scale the way drafting capacity now does.
| Observable symptom | Likely constraint | Suggested intervention |
|---|---|---|
| Drafts pile up waiting for review | Reviewer capacity | Train additional qualified reviewers; apply risk-based review depth consistently |
| Research takes longer than drafting | Research workflow or source access | Apply structured AI Research Workflows discipline; improve source hierarchy and tooling |
| Specific content categories stall repeatedly | Scarce subject-matter expert availability | Apply Expert Knowledge Capture to reduce repeated expert time demand |
| High rework after review | Unclear brief or acceptance criteria | Tighten the Research & Briefing contract; clarify risk-tier-specific criteria |
| Approved content waits before publishing | Publishing operations capacity or unclear sign-off authority | Clarify decision rights; streamline the publication handoff |
Improvement effort applied anywhere other than the actual constraint tends to produce little visible system-level benefit, even when it genuinely improves the stage it targets, because the overall pipeline’s throughput is set by its tightest constraint, not by the average capacity across every stage.
This has a specific, counterintuitive implication worth stating directly: investing further in making drafting faster, once drafting is no longer the actual constraint, produces close to zero system-level benefit, no matter how impressive the drafting-stage improvement looks in isolation. An organization that keeps investing in drafting speed after the constraint has moved to review or research is optimizing a stage that already has slack capacity relative to what the rest of the system can absorb, which is a natural but unproductive instinct once a tool clearly demonstrates it can draft faster. The discipline here is continually re-identifying the actual constraint rather than assuming it stays fixed at whichever stage was historically the slowest.
Improve with AI and Automation
AI and automation should be applied to bounded, well-defined tasks where the organization can verify output quality reliably, not broadly across every task a stage happens to involve. Drafting assistance, research triage, and structured extraction tasks, covered in depth in AI Research Workflows and the AI Editorial Operating System, are generally good candidates. Tasks requiring judgment under ambiguity, interpreting conflicting evidence, making a final risk-tier call, are poor candidates for unsupervised automation regardless of how much time they appear to consume.
Every automation decision should explicitly weigh the quality risk against the time saved, rather than treating speed as the only relevant variable. An automation that saves meaningful time on a low-risk task is a clear win; the same automation applied to a high-risk task, where an error carries a disproportionate cost, may not be worth the time saved even if it works correctly most of the time, because the cost of the times it doesn’t work correctly can outweigh the aggregate time savings.
It’s also worth distinguishing automation that removes a task entirely from automation that changes who performs it without actually reducing total effort. Automatically generating a first-pass structured outline from an approved brief removes real work a person previously did by hand. Automatically generating a draft that still requires the same depth of fact-checking and revision a human draft would have required has, in effect, relocated the effort rather than reduced it, and a measurement system that only tracks drafting time will overstate the efficiency gain in exactly this situation. The Quality-Adjusted Content Flow Scorecard introduced above exists specifically to catch this kind of apparent gain that doesn’t survive a full-system accounting.
Experiment and Standardize
Process changes should be tested as deliberate experiments, not rolled out universally on the strength of a plausible argument alone. A proper experiment defines a baseline (current performance on the relevant metrics), a specific hypothesis (what change is being tested and why it should help), the guardrails that must hold throughout (the quality and value metrics that must not degrade), a defined test period, and a decision rule for what happens based on the result, standardize the change, revise it, or abandon it.
Standardizing a change that passed its experiment means documenting it clearly enough that it becomes the new default practice, not something that quietly reverts the moment the person who championed it moves to a different project. Standardization without documentation is the most common reason a genuinely good process improvement fails to persist past its initial pilot.
Guardrails need to be checked throughout the experiment, not only at its conclusion. A change that appears to be working well on its headline metric partway through the test period can simultaneously be quietly degrading a guardrail metric that nobody’s actively watching until the test period ends and the full picture becomes visible, by which point the change may already have been informally adopted elsewhere. Checking guardrails at regular intervals during the test, not just as a final pass/fail gate, catches this kind of drift while there’s still time to adjust the experiment rather than discovering the problem only after the fact.
Economics and Capacity Decisions
Capacity and tooling decisions should be made using full costs, not just the visible cost of a software license or a drafting tool subscription. Review time, specialist time, rework cost, and ongoing maintenance cost all belong in the calculation, and a decision made without them will systematically overestimate how much a given investment actually saves the organization.
Headcount decisions deserve particular caution when they’re based primarily on a tool vendor’s demo or a pilot conducted under unusually favorable conditions. A drafting tool that performs impressively on a clean, well-scoped pilot task may perform quite differently once it’s handling the organization’s full range of content, including the messier, more ambiguous requests a demo never covers, and a capacity decision made before that reality is understood can leave the organization under-resourced exactly where it needs capacity most.
Capacity decisions should also account for the maintenance burden a growing content library creates over time, not just the cost of producing new content. Every published asset that the organization intends to keep accurate and current adds, in a small but real way, to the ongoing maintenance load, checking claims as sources update, confirming framework references stay aligned with the glossary, verifying links still resolve. An efficiency analysis that counts only production cost and ignores this accumulating maintenance tail will systematically understate the organization’s true content operations cost as the published library grows, which can make a content expansion that looked clearly justified at launch look considerably less favorable once a few years of maintenance obligation have accumulated behind it.
Failure Modes for Content Production Efficiency
Local optimization, improving one stage’s metrics without regard for the system’s overall throughput, is the most common failure, and it’s seductive precisely because the local improvement is real and measurable even when its system-level effect is negligible or negative. Vanity output, celebrating raw volume increases without checking quality-adjusted throughput, is a close second. A third is treating time saved during drafting as automatically realized business value, when in practice that saved time frequently just gets absorbed into producing more of the same kind of content rather than being redirected toward higher-value work.
A fourth, easy to overlook until it’s already a problem, is measuring utilization instead of flow. A reviewer or writer who appears fully utilized, booked solid with work, every hour accounted for, is not necessarily contributing to faster overall delivery; a fully utilized system has no slack to absorb variability, which paradoxically tends to increase queue time and cycle time rather than reduce it, because any unexpected complexity or urgent request has nowhere to go without displacing something else already in progress. A system with some deliberate slack capacity, rather than one tuned for maximum utilization, often delivers more reliably and with shorter average wait times, a counterintuitive result that becomes clear only once queue time is actually measured rather than assumed to track utilization directly.
Frequently Asked Questions
Does faster drafting always improve overall efficiency?
No. If reviewer, specialist, or approval capacity doesn't also increase, faster drafting simply moves the bottleneck downstream, often creating a larger backlog at whichever stage becomes the new constraint.
What's the difference between this guide and Content Supply Chain?
This guide focuses on measuring and improving flow and quality within the production system. Content Supply Chain addresses the broader capacity, dependency, and resilience design across the whole operation, including partner management and single-point-of-failure risk. The two are complementary: a supply chain can be well designed and still run inefficiently if nobody is measuring it, and metrics alone can't fix a structurally under-resourced pipeline.
How do you know if an efficiency metric needs a guardrail?
If optimizing that metric in isolation could plausibly degrade quality, risk management, or business value, it needs an explicit guardrail. In practice, nearly every flow metric meets this bar, which is why every metric in this guide's table includes one.
Is it ever acceptable to reduce headcount based on AI-assisted efficiency gains?
That's a business decision outside this guide's scope, but it should never be made from drafting-stage time savings alone. It requires a full-system view of where capacity is actually constrained, since the constraint has typically moved to research or review, not away from the organization's overall capacity needs.
How often should the workflow map and metrics be revisited?
Whenever a significant process or tooling change is introduced, and as a standing practice at least quarterly, since constraints shift over time as AI capability, team composition, and content volume all change.
What's a reasonable first step for an organization that isn't measuring any of this yet?
Start narrow rather than attempting to instrument the entire pipeline at once. Pick cycle time and first-pass yield, the two metrics that most directly reveal whether work is flowing well and whether upstream quality is holding, apply them to a single content category for one full measurement period, and only expand the metric set and scope once that first narrow measurement is established and trusted. Attempting a comprehensive measurement rollout across every metric and every content category simultaneously tends to produce a reporting burden heavy enough that it collapses under its own weight before it generates any usable insight.